

Key Takeaways
What a DEXA Scan Actually Measures
Dual-energy X-ray absorptiometry - commonly called a DEXA or DXA scan - uses two low-dose X-ray beams at different energy levels to distinguish between three distinct tissue types in the body: fat mass, lean (non-fat) mass, and bone mineral content. Because each tissue absorbs X-ray energy differently, the scanner can mathematically separate them with a high degree of precision.
This three-compartment model is one reason DEXA is considered a gold-standard method for body composition assessment in research and clinical settings. Compare that to a standard bathroom scale, which only captures total body weight, or even a BMI calculation, which adds height but still cannot distinguish muscle from fat. As explained in our guide on body composition versus body weight, two people can share an identical weight and look very different on a DEXA report.
The scan itself typically takes 10-20 minutes. You lie still on a padded table while an imaging arm passes over your body. No injections, no claustrophobia - radiation exposure is minimal, generally far lower than a standard chest X-ray.
Breaking Down the Numbers on Your Report
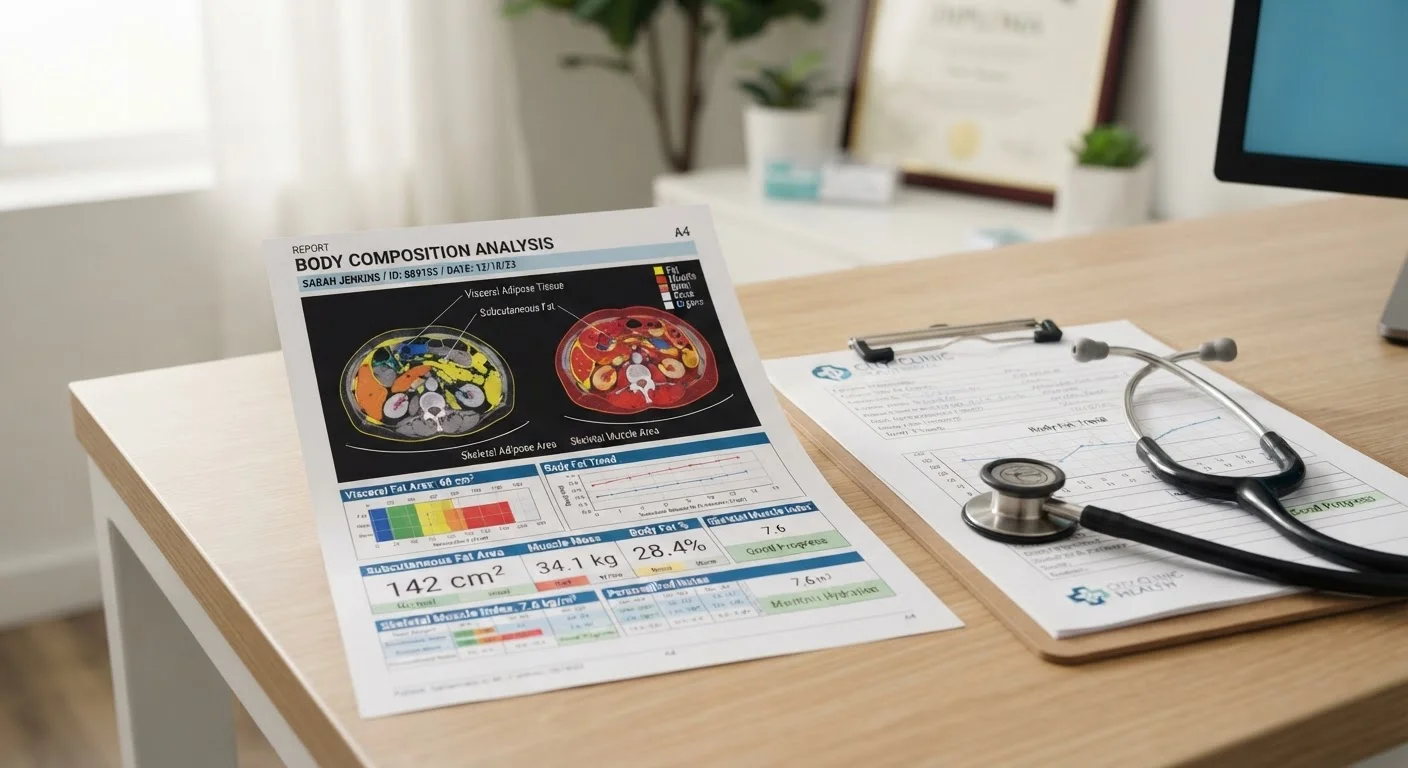
Most DEXA reports are organized into three major sections. Here is what each one captures:
Fat Mass and Body Fat Percentage
Fat mass is the total weight of adipose (fat) tissue in your body. Body fat percentage expresses that mass as a share of total body weight. Reports typically show these figures for the whole body and then broken down by region: left arm, right arm, left leg, right leg, trunk (torso), and sometimes the android (abdominal) and gynoid (hip/thigh) zones specifically.
The android-to-gynoid ratio deserves attention. A higher concentration of fat in the android region - commonly called visceral or central fat - is associated in research with greater cardiometabolic risk compared to fat distributed lower in the body. However, interpreting these ratios meaningfully requires clinical context; a number on its own is not a diagnosis.
Lean Mass
Lean mass represents everything that is not fat or bone: muscle, organs, connective tissue, and body water. On many reports this is labeled lean soft tissue. Tracking lean mass over time is particularly useful for people engaged in resistance training programs or those monitoring muscle health during aging, since muscle loss (sarcopenia) can be subtle and difficult to detect without objective measurement.
Regional lean mass data - how much muscle is in each limb - can also help identify asymmetries that might be clinically relevant, particularly in rehabilitation contexts.
Bone Mineral Density (BMD)
BMD measures the concentration of minerals (primarily calcium) in your bones, reported in grams per square centimeter (g/cm²). This section of your report will also include two standardized scores:
- T-score: Compares your BMD to a healthy young adult reference population. A T-score of 0 means you match the reference average. Scores below −1.0 may indicate lower-than-average bone density; below −2.5 is the clinical threshold for osteoporosis diagnosis.
- Z-score: Compares your BMD to people of your own age, sex, and ethnicity. This is often more relevant for younger adults and children.
For a broader look at how these measurements fit into the full picture of body composition, see our resource on fat, muscle, bone, water, and how they interact.
How to Interpret Reference Ranges Without Over-Reading Them
Every DEXA report places your results alongside reference ranges, often shown as percentile rankings or color-coded zones. These ranges are derived from population studies and represent statistical distributions - they describe what is common, not what is optimal or required for any individual.
For example, a body fat percentage in the "above average" zone does not automatically indicate a health problem, just as a percentage in the "athletic" zone does not guarantee good metabolic health. Other factors - sleep quality, cardiovascular fitness, diet quality, stress, genetics - all contribute to health outcomes in ways a single scan cannot capture. Our companion article on what fat, muscle, and bone actually tell you about health explores this nuance further.
The most valuable use of a DEXA scan is longitudinal - tracking your own results across scans taken months or years apart under consistent conditions (same time of day, similar hydration, same scanner if possible). A trend in lean mass or bone density over time tells a more actionable story than any single data point.
Bring Your Report to Your Next Appointment
DEXA reports can look dense and unfamiliar at first glance. Bringing a printed or digital copy to your primary care provider or registered dietitian allows them to interpret the numbers in the context of your full health history. They can explain which values are most relevant to your personal goals and flag any areas worth monitoring.
This article is for general informational and educational purposes only and does not constitute medical advice. DEXA scan results should always be interpreted by a qualified healthcare professional in the context of your individual health history and goals.