

| General body fat range - adult women | ~20-35% (American College of Sports Medicine general reference ranges) |
| General body fat range - adult men | ~10-25% (American College of Sports Medicine general reference ranges) |
| Approximate muscle mass decline per decade after age 30 | 3-8% (Journal of Cachexia, Sarcopenia and Muscle, published estimates) |
| Age range when muscle loss typically accelerates | After age 60 (General consensus across aging and sarcopenia research) |
| Essential fat (minimum functional level) - women | ~10-13% (ACSM; essential fat supports hormonal and reproductive function) |
| Essential fat (minimum functional level) - men | ~2-5% (ACSM; essential fat supports basic physiological function) |
Why 'Healthy' Isn't a Single Number
When people ask what a healthy body composition looks like, they're often expecting a single, universal number. The science tells a more nuanced story. Body fat percentage, lean mass, and bone density all shift in predictable patterns across the lifespan - and they differ meaningfully between biological sexes. What's considered an appropriate range for a 25-year-old woman isn't the same as what's appropriate for a 65-year-old man.
This isn't a flaw in the research - it's a reflection of biology. Hormonal environments, reproductive function, and age-related physiological change all influence how the body stores and maintains fat and muscle. Understanding these ranges is useful not as a personal target to chase, but as a reference framework for interpreting measurements in context.
For a foundational overview of what body composition actually measures, see our guide to what fat, muscle, and bone tell you about health.
| General body fat range - adult women | ~20-35% (American College of Sports Medicine general reference ranges) |
| General body fat range - adult men | ~10-25% (American College of Sports Medicine general reference ranges) |
| Approximate muscle mass decline per decade after age 30 | 3-8% (Journal of Cachexia, Sarcopenia and Muscle, published estimates) |
| Age range when muscle loss typically accelerates | After age 60 (General consensus across aging and sarcopenia research) |
| Essential fat (minimum functional level) - women | ~10-13% (ACSM; essential fat supports hormonal and reproductive function) |
| Essential fat (minimum functional level) - men | ~2-5% (ACSM; essential fat supports basic physiological function) |
Body Fat Percentage Ranges by Age and Sex
Body fat percentage - the proportion of total body weight made up of fat tissue - is one of the most commonly referenced body composition metrics. Professional organizations such as the American College of Sports Medicine (ACSM) have published general reference ranges, though these are population-level estimates, not clinical thresholds.
For adult women assigned female at birth, a commonly cited range for general health falls between approximately 20-35% body fat, with ranges shifting upward modestly in older age groups (roughly 55 years and above). Women typically carry more essential fat than men due to hormonal and reproductive physiology - this is normal and expected.
For adult men assigned male at birth, reference ranges for general health fall roughly between 10-25%, again with ranges broadening somewhat in older decades. Men tend to carry proportionally less fat and more lean mass on average, though this advantage narrows with age.
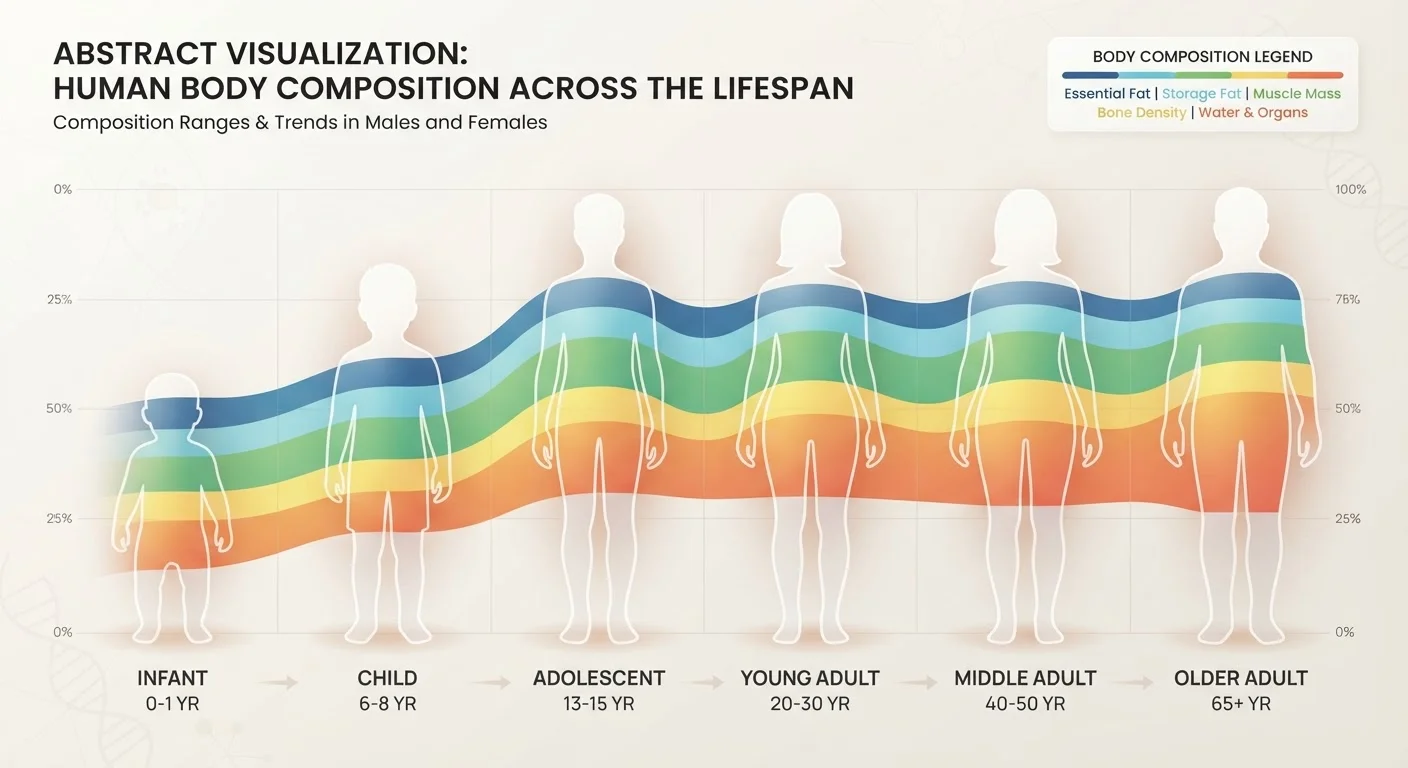
Both sexes see a natural increase in body fat percentage across the lifespan, even when total body weight stays stable, because lean muscle mass tends to decline after the fourth decade of life. This process - known as sarcopenia when it becomes clinically significant - is explored in depth in our article on how aging shifts body composition.
Body fat percentage
The proportion of total body weight made up of fat tissue, expressed as a percentage. This includes both essential fat (needed for basic bodily function) and storage fat.
Lean mass
All body tissue that is not fat, including muscle, bone, water, and organs. Higher lean mass relative to total weight is generally associated with better metabolic and functional health outcomes.
Sarcopenia
The progressive, age-related loss of skeletal muscle mass and strength. It is a clinically recognized condition associated with reduced physical function and increased health risk in older adults.
Essential fat
The minimum amount of fat required for normal physiological function. Essential fat levels differ between biological sexes - women require more due to hormonal and reproductive physiology.
Appendicular lean mass index
A research measure of muscle mass in the arms and legs divided by height squared, used in clinical studies to assess sarcopenia risk in older adults.
These ranges are general population references, not medical benchmarks for individual assessment. Always consult a qualified healthcare provider for personalized interpretation of body composition data.
Muscle Mass and What the Evidence Suggests
Lean muscle mass - sometimes expressed as skeletal muscle mass or fat-free mass - declines at roughly 3-8% per decade after age 30, with the rate accelerating after 60 according to research published in journals including the Journal of Cachexia, Sarcopenia and Muscle. This decline is one reason body fat percentage naturally rises even without significant changes in eating or activity habits.
There's no single widely standardized "healthy" muscle mass percentage the way there is for body fat, but relative muscle mass indices (such as appendicular lean mass divided by height squared) are increasingly used in clinical research to identify sarcopenia risk in older adults. Higher relative muscle mass is generally associated with better metabolic health, functional independence, and reduced all-cause mortality risk - though correlation doesn't establish causation in any individual case.
For a broader look at how daily habits shape these numbers over time, see our piece on lifestyle factors that influence body composition.
It's also worth distinguishing body composition from body weight, since two people with identical scale weights can have very different fat-to-muscle ratios. Our article on body composition vs. body weight covers this distinction in detail.
This article is for general informational purposes only and does not constitute medical advice. Speak with a qualified healthcare professional for personalized guidance on body composition and overall health.